The past – remember the net premium valuation method?
In the past, the valuation of liabilities is predetermined through a minimum valuation interest rate, minimum mortality basis and a valuation methodology which only implicitly allows for expenses and with no provision for the effect of surrenders and lapses. In most cases, this is conservative. The cost of options and guarantees were hidden within this estimate.
The assumptions and reserving methodology were “artificial”. Assets were taken at the lower of book or market value. Again, there can be significant margins in the value of assets – for example when assets were bought at a significant discount to current market value.
The explicit solvency margin computation is only dependent on reserves and premium, and in some cases the sum at risk. It ignores the riskiness of asset composition altogether.
In such a regulatory environment, solvency of insurers is at greatest risk from a drop in market value of equities. The risk of changes in the value of bonds affecting solvency was limited if treated as ‘held to maturity’.
Now – RBC and RBCT
The introduction of risk based capital introduces the concept of ‘best estimate’, and subsequently 75th percentile, 99.5th percentile in the value of liabilities. The former was used to determine reserving requirement and the latter was a proxy to ensure there is sufficient buffer to ensure a 1 in 20 risk of insolvency in one year.
Further RBC and RBCT places a “price” on holding volatile (risky) assets and via the interest rate risk charge, a “price” on ‘unhedged’ liabilities.
Currently, there is limited recognition of diversification benefit and no provision for illiquidity premium.
Do we need ALM?
Prior to RBC and RBCT, the value of ALM may be restricted due to the many implicit margins in the valuation of liabilities and assets. With RBC and RBCT, management needs to understand where the risks lie. The regulators are looking at insurers and takaful operators to manage risks as these are now clearly quantified.
The Regulators expects that business decisions will revolve around managing these risks. ALM is the “bridge” between the two sides of the insurers balance sheets. For takaful it is even more complicated, considering multiple balance sheets of participants and the operator needs to be managed.
Moving from Net Premium basis to Risk Based Capital – What does this mean?
Capital is required to back business – the required capital is reflective of risks within assets and liabilities. This regulatory capital, however, may not be necessarily correct in reflecting true underlying risks – it does not for example consider illiquidity premium risk or account for diversification benefits and the risk charges themselves may be challenged – but nevertheless is an economic cost to consider as it ties down shareholders’ capital that may be otherwise be used to fund other ventures. This tied capital needs to be rewarded appropriately.
While the solvency capital determines the Capital Adequacy Ratio (CAR) at a particular date of measurement, it does not say much in terms of the future direction of solvency. The CAR does not capture the impact of future new business neither does it fully capture the impact on CAR of the future movement in the value of assets. With all implicit margins being stripped away it is even more important to consider the dynamic interplay between liabilities and assets and this can only be assessed through ALM.
How to approach ALM under the current scenario
The approach would depend on your viewpoint:
If you are risk adverse and have little confidence in the ability of RBC and RBCT to correctly capture the relationship between assets and liability, you should take actions to minimize risk on your balance sheet. This means for life insurers -sell investment linked products, i.e. effectively pass as much risks back to the policyholders as you can.
For general insurance companies, ensure that you underwrite profitably. Sell only short tail, low volatility business and put all assets in cash and short term bonds.
If you take the view that ‘Risk presents an opportunity to profit’, you would likely work around the RBC and RBCT, BUT ensure that capital is adequately compensated.
ALM can be used for quantifying future risk which allows the company to determine future required capital. As long as the cost of this capital can be priced into the insurer’s products, this works.
This rule also applies for general insurers. Even though you have short term liabilities, if and only if you expect to continuously experience a positive cash flow, you can consider investing in equities. However, you would need to ensure that the higher risk capital required as a result of investing in equities is sufficiently rewarded by expectations of a higher return to shareholders within a reasonable level of probability which is within your risk appetite.
ALM can assist in determining this probability.
Applying ALM in practice
However, application of ALM in itself can be challenging. There are several issues to consider when performing an ALM which we discuss below.
Is the ESG output reasonable?
Is the future really random? Are markets performance in any particular year independent of what happened last year and will not have any influence in what is expected to happen the following year? Random number generator is available on Excel but used solely the output scenarios will not be reasonable. There is an assumption of normality in the distribution of returns, while a good economic scenario generator or ESG should take into account historical data – at the very least, the mean and the volatility of each asset class. The non-normality of asset classes is especially a challenge when analysing the tail risk of extreme scenarios – for e.g. at the 99.5th percentile. Further, the ESG should take into account correlation between different asset classes. Another reason why one should not simply use random number generators is that they are likely to churn out scenarios showing inconsistent year on year movement which is not realistic as evidenced by historical data.
Mapping ESG outputs to liabilities require a full yield curve simulation to value reserving and solvency requirements. Generation of yields of different maturity terms cannot be modelled independent of each other.
Use of mean reversion techniques can improve on consistency between year on year returns. However, there is a further starting period bias which only a qualitative overlay on the ESG can take into account.
Determination of Basis – treatment of New Business
This determination of basis has a large impact on the results of study. Considerations are different for an on-going business – new business coming in effectively extends the duration of the liabilities. In a closed to new business environment, liquidity may be an issue in meeting claims.
Management also want to consider business by cohort for a matching strategy. This makes sense if there is a significant liability from single premium/contribution short term endowments.
Relationship between Liability Model, the Asset Model and the Corporate Model
The diagram below summarises how the Assets and Liabilities interact in an ALM simulation.

In each economic scenario, the assumptions underlying the liability cashflows and the ESG need to be applied consistently. Downturn in economic scenario may have an impact of lapses, on new business, even perhaps higher claims on medical business. Hence the model needs to be dynamic enough to capture likely policyholders’ behaviour under different economic scenarios.
Further, for each of the simulations, the asset model will provide the risk free yield curve for the calculation of reserves and solvency requirement.
In turn both models feed their output to the top model. The top model will be used to calculate reserving positions, asset shares, asset values, solvency requirement surplus positions and any other financial items required for each year end. In fact, one common use of the model is to generate a revenue account for the projection period under consideration.
Here too, the corporate model can also include management’s decision before it continues the simulation for the next year. Management’s decision may include how and when to balance the asset allocation. An ICAAP exercise, which looks at the position in one year, may leave the assets at its initial allocation, whereas looking at a longer time period, an asset rebalancing rule is required for the results to make sense.
For participating products, including takaful, the model may also incorporate managements’ decision on whether to reduce bonuses in poor economic conditions.
Analysing the model output
The results of the simulations are then ready to be analysed. One simple approach is to plot the median, 5th and 95th percentile results for any items that are of interest – surplus positions, capital requirements against free assets. There are of course more sophisticated investigations that can be done, which depends on the objectives of the ALM. We illustrate in the next section how ALM can be used to address solvency issues.
Making a meaningful analysis
Addressing Solvency concerns
Solvency requirement is no longer straightforward and under a risk based capital framework, has many drivers. It is mainly influenced by the liability profile, the assets held, and the matching strategy. The last item is captured via the interest rate risk charge (which captures the difference in movement of assets and liabilities from a change in interest rate). Liability risk charges meanwhile capture the capital that is required to meet a 1 in 20 chance of ruin in one year. Asset charges would depend on the investments held and the mandated schedule of charges.
Liability and solvency requirement changes with movements in interest rate. Asset values are marked to market (except perhaps held to maturity fixed interest investments). The interrelationship between the three has an impact on the all important Capital Adequacy Ratio (CAR). Should CAR at any time drop below a supervisory limit (130% currently), there is a risk of regulatory intervention. Managing this Capital Adequacy Ratio hence requires investigating the likely movement of the surplus of assets over liability requirement (free assets) and that of the solvency or capital requirement.
If management is risk averse, the safest investment policy is that of matching current liabilities wherever possible. However if management accepts that risk represents opportunity, and seeks to maximise returns to shareholders subject to an acceptable level of risk exposure, ALM is a useful tool to investigate the impact of different asset allocation strategy.
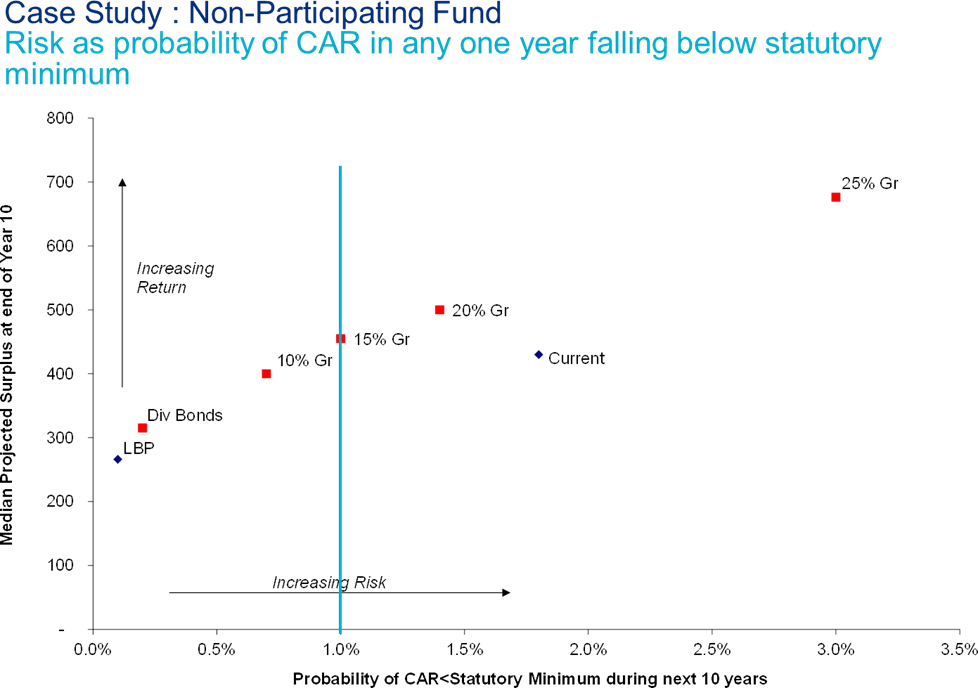
Source: Mercer (Singapore). Note values are for illustrative purposes only
This chart is an illustration of how different asset allocation strategy would have an influence over the probability of capital dropping below the statutory minimum requirement in the next ten years within a non-par fund. Given that more conservative strategies would also mean lower returns, this chart plots the median projected surplus at the end of the tenth year on the y-axis. This surplus is the median surplus of running a large number of simulations for each asset allocation strategy.
From the above, if management’s risk tolerance is 1%, a suitable asset allocation strategy is a combination of a matching portfolio and 15% of assets in a growth portfolio. In this particular example, comparing this to the current investment strategy (Current), this provides a slightly better return but with almost half the probability of ruin. Given that all excess returns in a non-par fund accrue to the shareholders while it bears all losses, this is a much better strategy.
Other uses of ALM
Once an ALM model is set up, they are myriad of investigations that can be performed – to manage solvency requirements, to arrive at a matched portfolio, and to manage policyholders expectation by testing expected returns and volatility of participating funds, even unit linked funds in insurance and participants fund in takaful. Table 1 provides further examples of ALM use.
Table 1: Example uses of ALM
| ALM under RBC | ALM under RBCT |
| 1. Managing the CAR, at fund level and at total level 2. Matching of assets to liabilities 3. Maximizing utilization of capital at a desired level of risk 4. Managing bonuses in the participating fund 5. Valuing guarantees for a particular asset allocation. | 1. Managing volatility of the Participants Account 2. Managing surplus distribution policy (to Participants and Operator) 3. Managing CAR at the Participants Risk Fund and overall at the Operators’ Fund. 4. Optimization of product mix from a Qard minimization perspective |
For example, selling investment linked business is not without its risk. Depending on market conditions, policyholders may not afford future risk charges (when they are older and hence face higher mortality charges) from fund value – leading to a risk of forced lapse, and worse for the policyholder no insurance cover. One simple way of testing this is to run simulations of annual returns of each fund to test the probability of not achieving the pricing assumptions. As a responsible insurer which is required to Treat Customers Fairly, this is one calculation that is important to perform.
Another example may simply be to limit the losses that can possibly be incurred in any particular year. In the chart below we illustrate the worst case scenario (at 0.5th percentile) of a possible loss in any one year. We see that investing wholly in cash limits this loss but provide a lower return. Riskier assets provide better returns but carry a higher worst case annual loss.
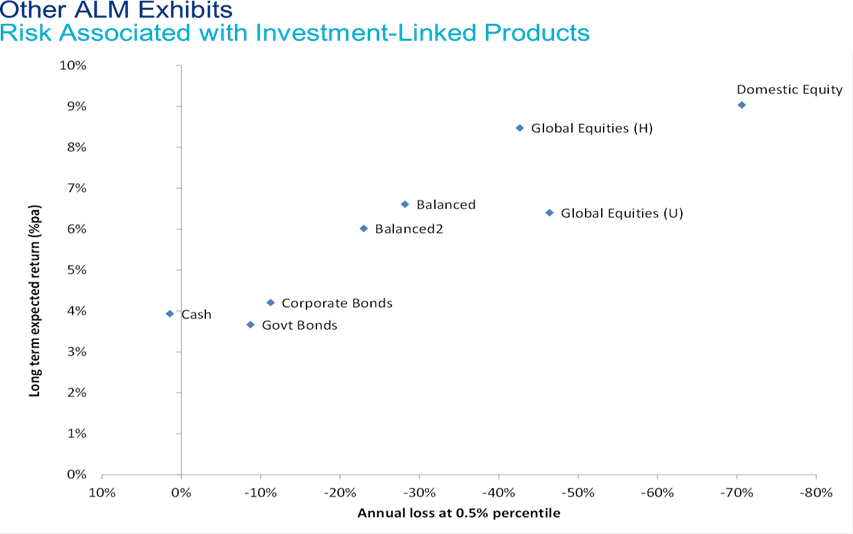
Source: Mercer(Singapore). Note values are for illustrative purposes only
Building Blocks of an SAA
One of the definitive uses of an ALM is to determine a Strategic Asset Allocation (SAA). The SAA
defines the management’s long term asset allocation strategy. This entails combining the technical expertise of senior management from the investment department, the risk management and actuarial. We simplify the building blocks of an SAA into 7 steps below;
- Understand the risk profile of different stakeholders
- Formulate fund objectives for the SAA
- By considering expected liabilities, build a base asset portfolio to meet “guaranteed” or non- discretionary liabilities
- Run simulations of assets against liabilities for different strategies of combining base portfolio with x% exposure in “growth” assets
- Compares results against stated objectives to choose “candidate” portfolios
- Stress test “candidate portfolios” to ensure a suitable SAA is chosen
- Formulate an investment policy around the chosen SAA. As mentioned above, the SAA is a long term asset allocation designed to meet long term objectives. There can be opportunities to temporarily diverge from SAA to either profit from market conditions or manage a liability profile. Thus an SAA should also include a dynamic asset allocation plan to be complete.
Next step
Given that it gives clarity to objectives, it is no wonder that management of takaful and insurance companies are under pressure to demonstrate ALM use. In fact, most companies have long moved from considering assets and liabilities separately. However, this has only meant for many, a move into fixed interest securities at the expense of better returns from growth assets. This was initially done to minimise RBC market risk charges and to better match non-discretionary or guaranteed type benefits. As the market matures, we feel that given the advancement in technology, and given that the regulatory framework governing reserving and solvency is now clear and its application under control by companies’ internal software, it is time for management to take the next step of managing effectively the different concerns of their various stakeholders and in a more dynamic manner. For the shareholders, their concerns may mean more effective use of their capital and for participating policyholders, better returns on their policy. We hope we have demonstrated that ALM is the right tool for the job.


